
As part of setting up your website, I had you install Google Analytics.
Now that your site has been running for a while, it’s time to see why I suggested that, and explore the most important pieces of information you can get from Google Analytics.
Getting to Analytics
Visit Google Analytics (https://www.google.com/analytics/web/), logging in with your Google account if you need to. You’ll be presented with a list of all the sites for which you have Analytics configured.
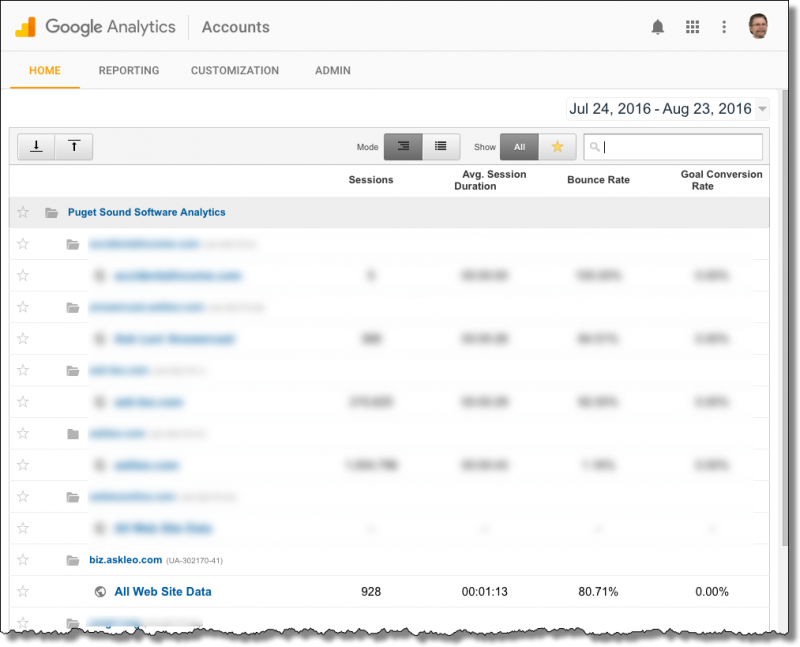
As you can see, I have many. You may have only one. For purposes of this article, I’ll be using the analytics for biz.askleo.com – the Ask Leo! On Business website itself – as my example. (The example site I’ve been using so far doesn’t get enough traffic to make the information useful for our purposes.)
Click on All Web Site Data to view analytics for your site.
The analytics are divided into four major reporting sections:
- Audience – your site’s visitors.
- Acquisition – how your site’s visitors came to visit your site.
- Behavior – what your site’s visitors did while on your site.
- Conversions – what I’ll call desired outcomes: how many visitors went to pages or paths you want them to during their visit.
In this overview, I’ll review the highlights of the first three. Highlights, because you could write books and run courses on all the different things you can do with Analytics, and only the first three, because Conversions is somewhat advanced all by itself.
Audience – who’s visiting?
The default view when you click on All Web Site Data is likely to be the Audience view.
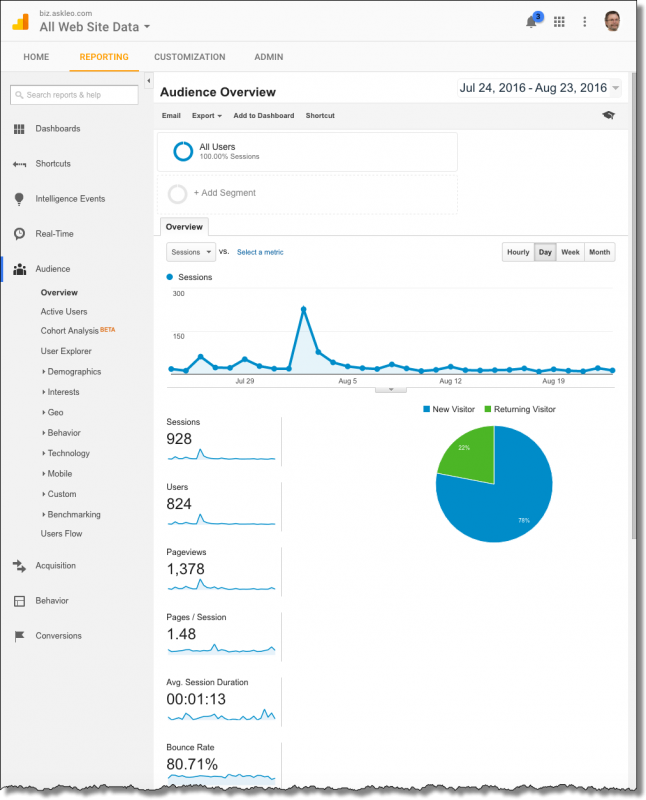
The most striking, and perhaps the most important top-line piece of information, is the graph of site visits over time. The default view is of the last 30 days.
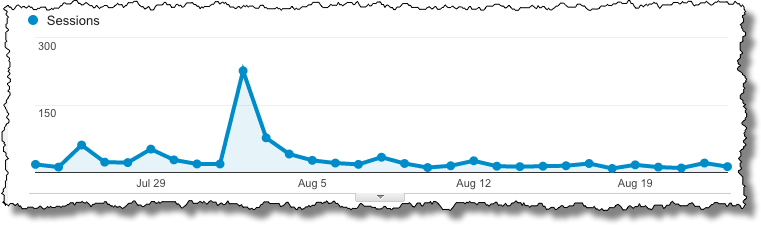
This is probably what most people care about the most: how many people visited their website. As you can see from this graph, biz.askleo.com had a spike of traffic, exceeding 250 sessions, on August 2nd. We’ll see if we can determine what was so interesting on that day in a moment.
A good example of a traffic pattern is that of Ask Leo! itself.
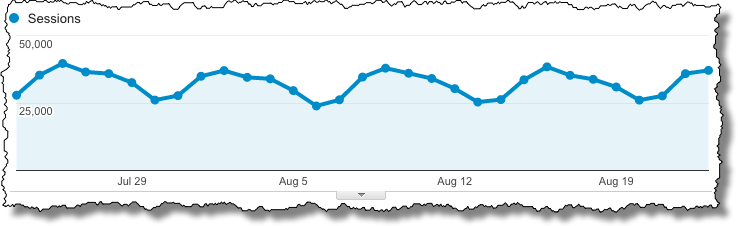
Traffic spikes each Tuesday as the newsletter goes out, and reaches its lowest point on weekends. Even without knowing exact numbers, patterns and spikes can be useful indications of what’s happening with your website.
Below the graph on the Audience Overview page are a number of additional interesting numbers, each designed to answer a high-level question about your audience.
- Sessions: how many times did people1 visit your site in the given time period? For example, if the same person visits once in the morning and once in the evening, that counts as two sessions. We had 928 visits to biz.askleo.com in this time period.
- Users: how many different people were there? There were 824 different visitors.
- Pageviews: how many times were pages viewed? 1,378 pages were viewed on biz.askleo.com.
- Pages/Session: on average, how many pages does a visitor view when they visit your site? We see here that the average visitor to biz.askleo.com views a page and a half, meaning that many view just a single page, many view more than one page, and it all averages out to 1.48.
- Avg. Session Duration: how long did our visitors stay before moving on to other websites? In the case of biz.askleo.com, the average duration is a minute and thirteen seconds. Since it probably takes longer than that to read one of the articles on the site, this tells me that most visitors probably just skim, or don’t read the entire page.
- Bounce Rate: how many visitors view exactly one page on their visit? Put another way, how many people view a page, read it (or not), and then immediately leave?
- % New Sessions: how many visitors have never visited this site before?
This is incredibly valuable information, as you can guess, but don’t be anal about it. The numbers represent trends, not absolutes. Many different things can affect their absolute accuracy. For example, the same person visiting the site twice using two different browsers, or after clearing cookies, or after an IP address change, or after any number of things, could very well be counted as completely separate visitors/sessions. (This is typically why “% New Sessions” is often over-stated.)
Along the left of the overview page are several different characteristics of site visitors to explore. As just one example, I’ll click on Geo and then Location to see where my visitors are coming from.
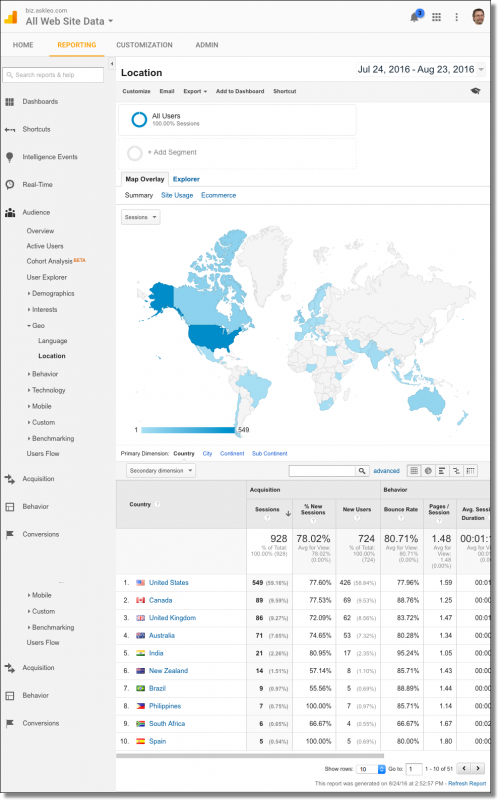
While over half the visitors to biz.askleo.com are in the United States, over 40% are not. Depending on your situation, you might want to tailor the information you present on your site accordingly.
Some information available about your visitors, including Demographics (age and gender) and Interests, must be enabled before it’s displayed. Other available information of note includes Technology (which browser, operating system and even ISP network they might be using), Mobile (including not only what percentage of the visits are on mobile devices, but what device is being used), and much, much more.
Acquisition – how’d they get here?
The Acquisition overview can tell you in detail how people are finding your website.
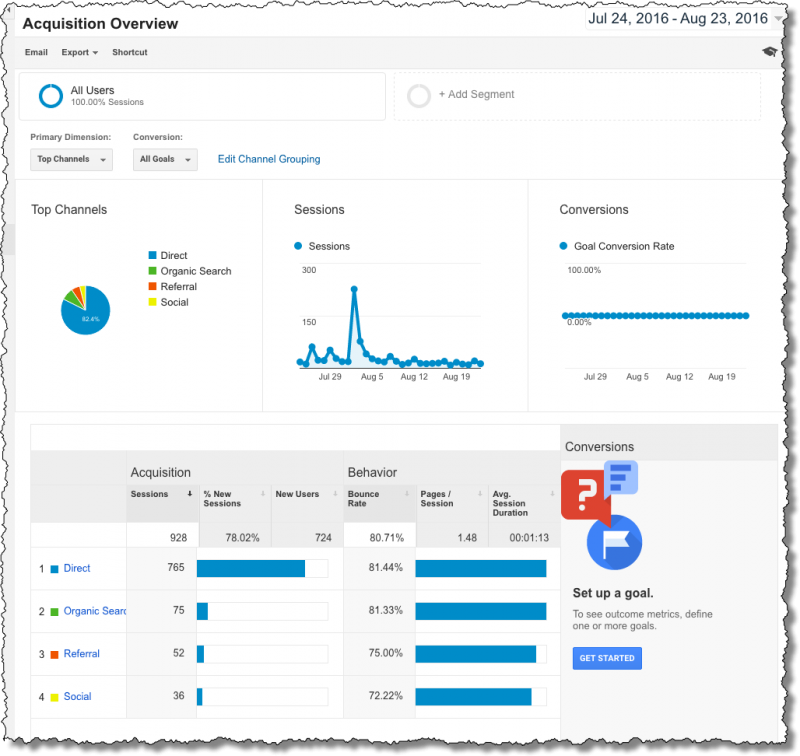
For biz.askleo.com, we see that the vast majority of visitors arrive “Direct”, meaning they simply followed a link to the site. This makes sense, since most visits are due to clicking a link in the newsletter or emailed notification of a new article that goes out when I publish something on the site. In comparison, the vast majority of askleo.com visitors arrive via “Organic Search”, meaning they clicked on a search result.
As with Audience, there are several different collections of information available as part of the Acquisition section. I encourage you to explore.
Behavior – what are they doing?
The Behavior overview begins with the familar graph of your traffic over time and some information we saw earlier. Below that is some exceptionally interesting information.
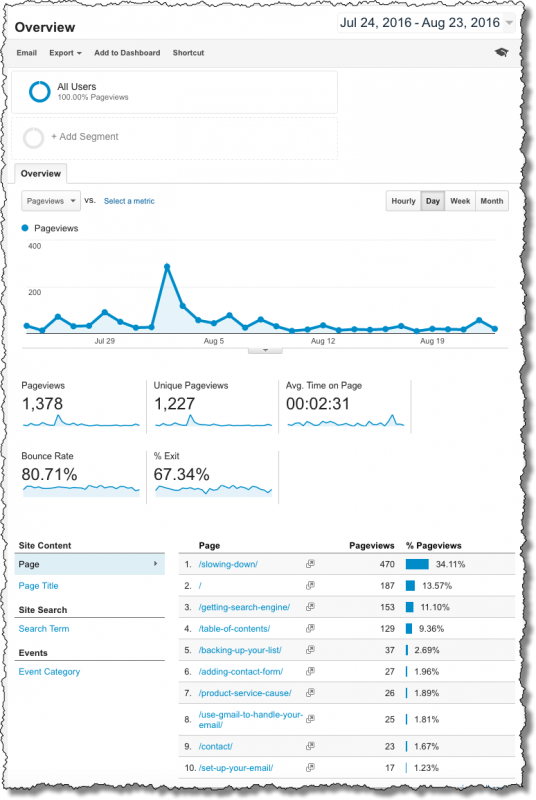
Specifically, you’ll find a list of your website’s pages ranked in order of page views. In other words, you’ll find out which pages on your site are the most popular, and had the most traffic in the specified time period.
In my biz.askleo.com example, the page “slowing-down” was top of the list – primarily due to that spike I mentioned earlier. Next up was the site’s home page, followed by “getting-search-engine”, the page with the article Getting Into the Search Engine.
The most popular content is not always the most recent. For example, at the top of the equivalent report for Ask Leo! is the article What’s the difference between a hub, a switch, and a router?, originally written in 2003. I used its consistent popularity as an indicator that the article should be updated, and did so in 2013. Three years later, it’s still my number one trafficked page.
In the Behavior section, you’ll also find reports helping you understand how people “flow” through your site, how fast your site is, some information on the search terms leading people to your site, and more. Once again, as with all of these sections, I encourage you to explore.
Answering the question: why the spike?
Earlier, we noted a traffic spike on August 2nd. I have a theory as to what that was, but let’s use it as an example for some very light research using Google Analytics.
Most commonly, a spike in traffic has to do with a page that somehow gained an above-average amount of attention. If you’re lucky enough to have a page actually “go viral”, for example, what you’ll find in your analytics the next day is an inordinate number of visits to that specific page.
Since we suspect a page has gotten above average traffic, we’ll start with “Site Content” in the “Behavior” section. Since we know what day this happened on, we’ll simply restrict the information on that report to a single day.
Start by clicking on Behavior (in the left hand sidebar), Site Content, All Pages.
Next, click the small triangle next to the displayed date range in the upper right. This will bring up a date range picker.
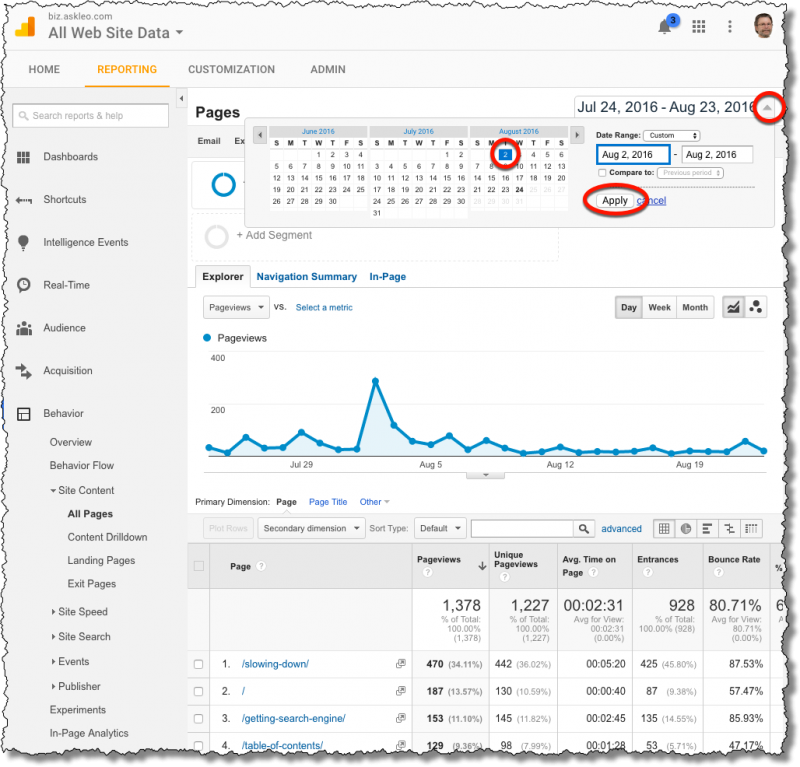
Simply click on the start date, and then the end date, that you want to use for this report. In our example, I’ll just click on August 2, twice, for a report spanning a single day. Click on Apply.
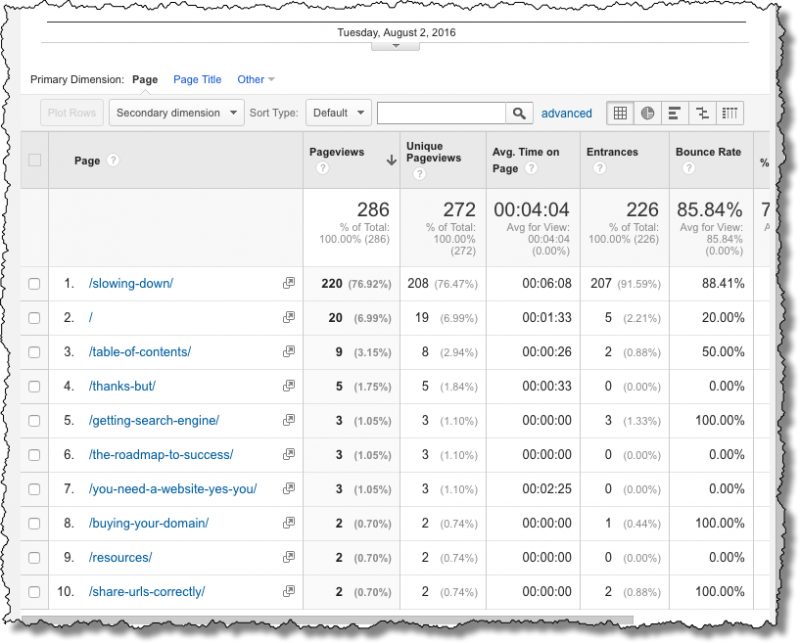
The graph becomes exceptionally uninteresting, showing only a single dot for the single day. However, the page list underneath has what we were looking for.
We can see that the “slowing-down” post got more than ten times as many views as any other page on that day. We can reasonably assume it was responsible for our traffic spike that day.
But why? The article was published on July 29th, and while there’s a small bump in site traffic on that day, it’s nothing compared to the August 2nd spike.
August 2nd is the day that The Ask Leo! Newsletter went out, which included a link to the most recently published Ask Leo! On Business article: Slowing Down. Even with only 220 views, it seems that my general newsletter, with over 60,000 subscribers, generated more traffic than the mailing a few days earlier sent only to Ask Leo! On Business subscribers.
That surprised even me.
Mine your analytics for value
Where your visitors come from, who they are, and what content is the most popular may be the most important information available via Google Analytics, but it’s truly just the tip of the iceberg. I encourage you to spend a little time exploring the various types of information Analytics reveals.
Understanding your audience’s behavior better is one way to measure the performance or success of your web site, but I see it as something else entirely.
To me, it’s a way to better understand their needs, desires, and what kinds of topics really resonate with them. I guarantee you’ll be surprised.2
Ultimately, it’s information to help you to do a better job of what I’ve been suggesting you do all along….
… add value.
Footnotes
1: Technically, the same computer and browser. Using a different computer or a different browser “looks like” a different session to web servers and analytics.
2: For example, there’s no way I would have predicted the apparent lasting value of an article discussing the difference between a hub, a switch, and a router.
Podcast: Download (Duration: 11:00 — 5.2MB)
The hits just keep on coming… What an education I am getting as I get ready to launch my site. Thanks again for your clear insightful information. I know there is no way I could be doing what I am (a DIY website) without your step by step instructions. Your continued insights and recommendations (such as SimpleURL) would take so much more time to figure out if I had to rely on just cold research. The result is more time spent on doing the task, rather than researching and hoping the info I got was right or just trying to sell me something. Saving time = saving money. You are a breath of fresh air, thanks again.
Thanks. This looks like exactly what I was looking for when I asked you to do this article. It’ll be interesting to see what’s been going on.
What do you think accounts for the popularity of “What’s the difference between a hub, a switch, and a router?”? Are people getting there via a search engine? of a link from another Ask Leo! article? I can sort of understand the peak on the “Slowing down article”. It might like some kind click bait effect. I’m mentioning these as possible ways to drive more traffic to the Ask Leo! site. I hate click bait, but links now a days need to have some kind of tease appeal to get a click response.
Diving a little deeper into the analytics, it looks like 87% of the traffic to that page is Google – meaning search results. I’ve always figured that there are classes out there which talk about the topic and that students are researching the answer. But that’s just a guess. 49% of the traffic to that page is “Asia”, with 25% coming from India.
If I load this page and read it and then leave, how does Google know I’ve left the page? It would seem that closing a browser tab would not generate anything measurable by Google since that is a local event and does not need to request anything. Also, If I load the page in a browser but go do something else before I read it, Google would seem to count that wait as engagement even though I’m not at all engaged with the page.
There are a variety of techniques. The most common is that when you install Google Analytics on your site the code from Google you add to it is notified on a page leave or page close event. That code can then report that event as part of your analytics information.